Deutsch
  Polski
 geographic information system
Approximately 80 percent of collected data are spatially related. Especially, surveyed data needs spatial positioning to make analysis and visualization of results in three dimensions possible. For this task, geographic information systems (GIS) are widely used.
GEO uses state of the art GIS-Software for data processing and administration. We are prepared for big data from sensors like LiDAR, Multibeam or Sub-Bottom. Our GIS analysts refine the data to create map series and web application among other products.
Difference models or digital terrain models (DTM) are produced to verify compliance of dredging depths with certain requirements or to accurately estimate sand filling volumes. Images of bathymetric data are suitable to give depth information and allow for interpretation of morphological and soil conditions.
Examples for the wide range of spatial analysis:
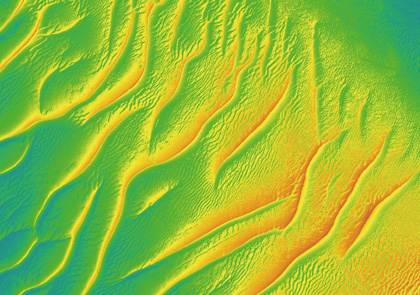
EABED VISUALISATION
Hill shading enhances morphological information
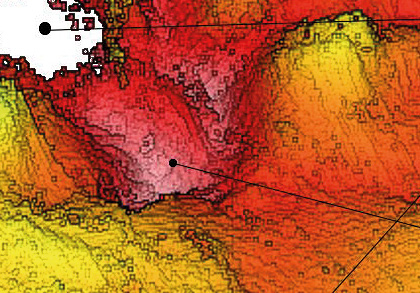
DIFFERENCE MODEL RESULTS
Current and previous data are overlaid to visualize the change of the seabed due to construction works or sediment transfer
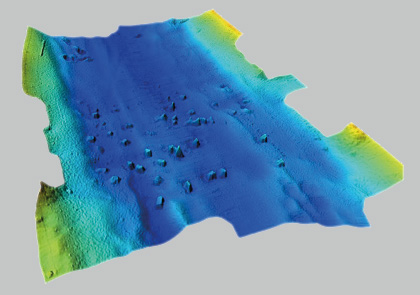
3D-SCENE
Three-dimensional data is used for promotional purposes or an enhanced spatial understanding